Monday
Morning Development Newsletter

South Korea and the environmental Kuznets Curve
By Lykke E. Andersen*, La Paz, 16 May 2011.
|
I usually start these newsletters with a famous quote,
but I thought these two pictures say more than any
phrase possibly could.
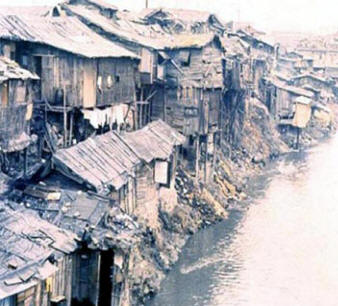
Photo1:
Chong-gye stream, Downtown Seoul (1950s)
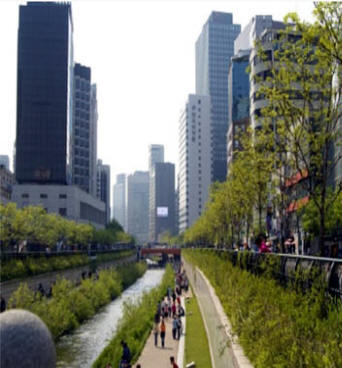
Photo
2:
Chong-gye stream, Downtown Seoul (2000s)
Source:
Reproduced with permission from Dr. Hwa Soo Park�s
presentation at INESAD, May 2011.
In 1960, South Korea was desperately poor with only half
the income of very poor Bolivia (see Figure 1). South
Korea was highly dependent on foreign aid, lacked
productive infrastructure, had no natural resources to
speak of, and was generally considered a hopeless case.
However, the population was quite well-educated for the
level of income, especially the women. In 1970, while
Bolivia was still 34% richer than South Korea, adult
Korean women (25 years and older) had on average 4.8
years of education, while in Bolivia the same group had
only 1.7 years of education. By now, South Korean women
have on average more than 12 years of education (exactly
the same as South Korean men), while Bolivian women have
only half that. And that is just in terms of quantity.
South Korean 8th graders are among the best in the world
in standardized math tests (beaten only by the Taiwanese
8th graders - by a single point on the 800-point-scale),
while Bolivians totally suck at these tests (1).
Figure 1:
Per capita GDP (PPP-adjusted international
inflation adjusted dollars)
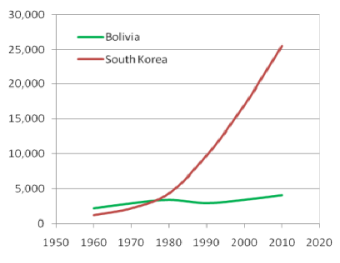
Source: Author's elaboration based on data from
www.gapminder.org.
The relatively high level of education of women in South
Korea encouraged a dramatic drop in fertility rates. In
1970, South Korean women had on average 4.5 children
each while Bolivian women had 6.5 children. Today, South
Korean fertility levels are well below replacement
levels at 1.2 children per woman, while Bolivian
fertility levels are still quite high at 3.4 children
per woman.
The advantage of low fertility levels is that they
permit higher rates of accumulation of productive
capacity. There is a big difference between financing
the education of 1 or 2 children per family instead of 5
or 6 and between handing over the accumulated family
assets to one heir rather than splitting it between 5
heirs. These low fertility rates have allowed South
Korean investment rates of 30-40% of GDP each year while
the Bolivian equivalent fluctuates around 15% of GDP,
which is barely enough to keep productive capacity per
person constant. The investment rates in Bolivia have
allowed an almost doubling of real incomes over the last
50 years, while the investment rates in South Korea have
allowed a 22-doubling of real per capita incomes. In one
short lifetime, South Korea changed from a desperately
poor country with no easy way to escape poverty, to one
of the most advanced, richest and best educated
countries in the world. The difference is well
illustrated in the photos above.
So, what did average economic growth rates of about 7%
per year for half a century mean for the Korean
environment? Certainly downtown Seoul looks greener and
healthier today than it did 50 years ago according to
the photos above. But South Korea didn�t worry at all
about the environment, until recently. South Korea is
the world�s 4th biggest energy importer, and
among the dozen biggest carbon emitters in the World.
This energy use is not just for own consumption, however,
but rather to produce all the high tech goods demanded
by the rest of the world. South Korea, although a small
country (less than a 10th of the size of
Bolivia) with only 50 million people, is one of the
world�s ten biggest exporters.
| | |